Create Infographics, Charts and Maps | Infogr.am
Infogram is an easy to use Infographic and Chart Making tool. With inforgram you can create and share beautiful infographics, online charts and interactive maps.
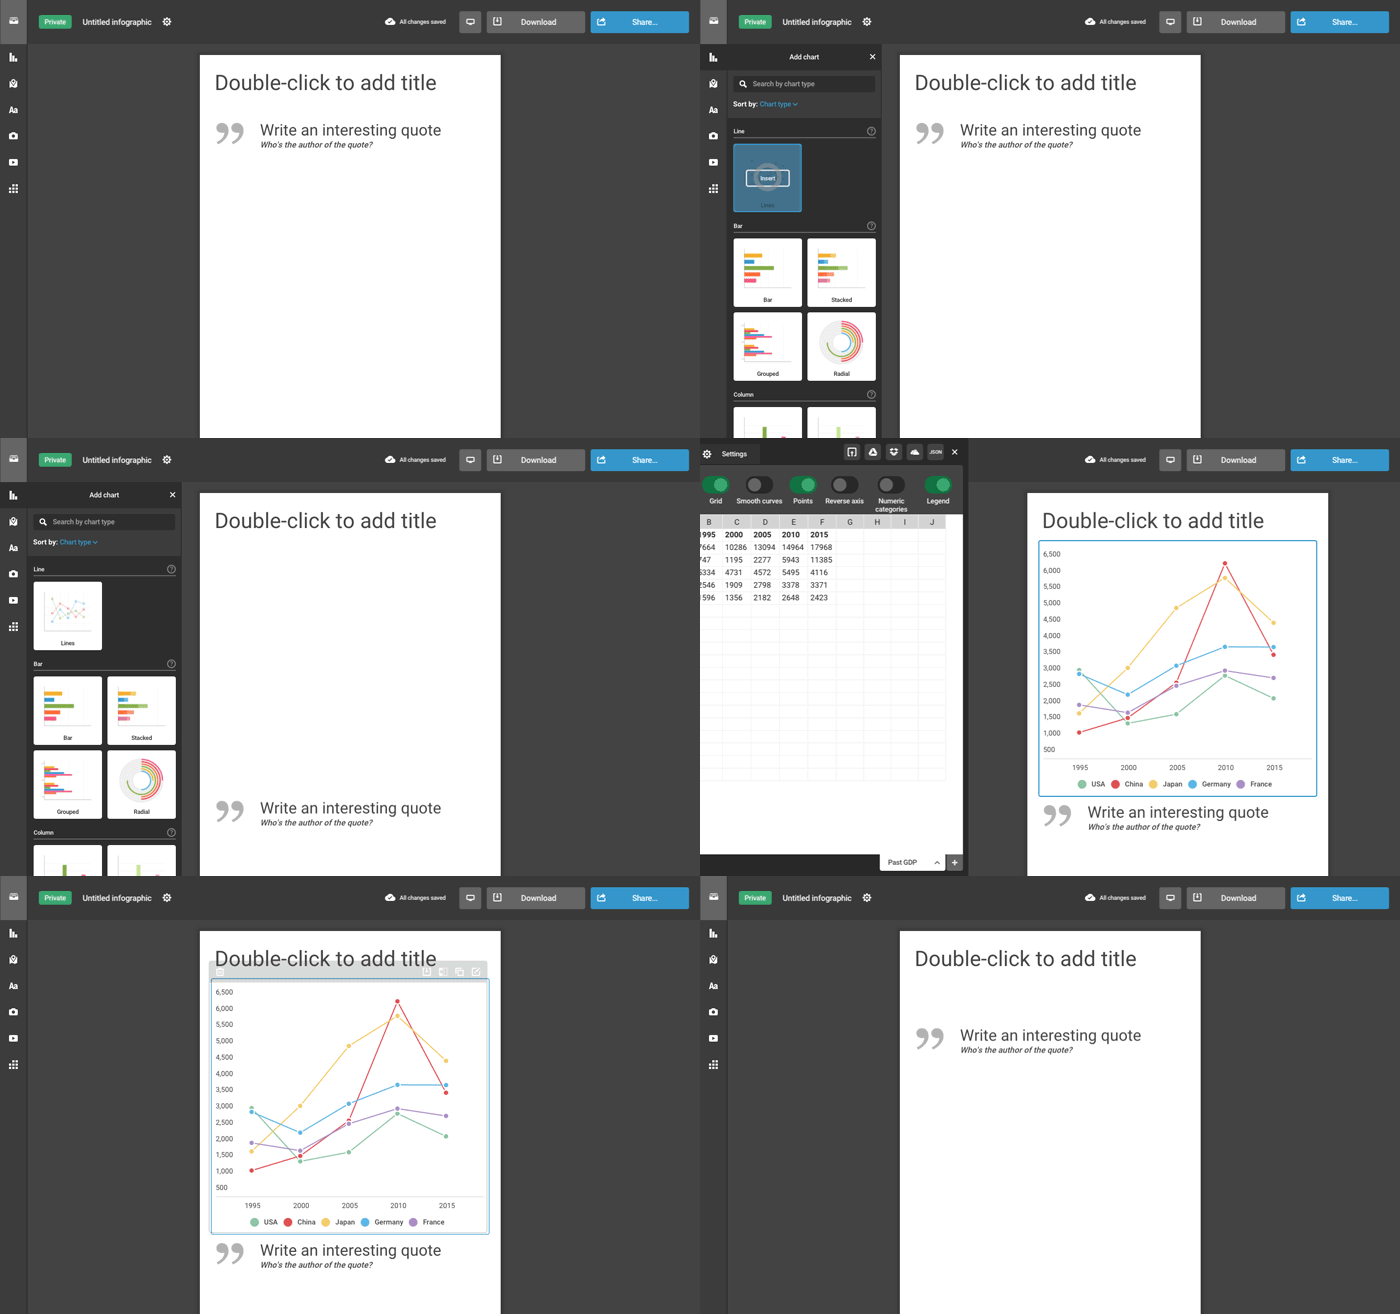
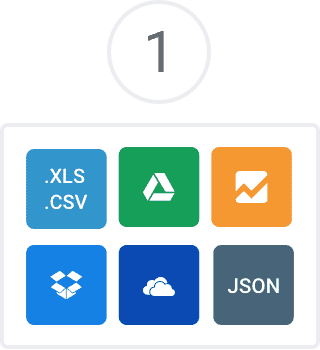
To use this you have to upload the data from multiple sources. Just copy data directy to the editor, upload a spreadsheet or connect to a live data source in the cloud. Than choose from 35+ Charts and 500+ Maps. Create all types of charts like interactive pie charts, line charts, bar charts, country maps or more complex ones like word cloud, facts & figures that viewers will love. Share and embed live charts & infographics into any website you want. Publish your data visualizations using the responsive embeds or our wordpress plugin. You can also download them as PDF, PNG or animated GIF.
Source: Create Infographics, Charts and Maps | Infogr.am


