


SQL Server Monitoring Scripts with the DMVs
If you want to know about combining the usage of 2 SQL Server DMV’s (sys.dm_exec_requests and sys.dm_exec_sessions) to create a non-intrusive and very efficient tool to monitor currently executed requests against SQL Server 2005 or SQL Server 2008 instance. 2 DMV’s to create T-SQL based monitor script are sys.dm_exec_requests and sys.dm_exec_sessions. This script can captures the code the SQL Server engine is processing at any point in time. Please see the query:
| SELECT T.[text], P.[query_plan], S.[program_name], S.[host_name], S.[client_interface_name], S.[login_name], R.* FROM sys.dm_exec_requests R INNER JOIN sys.dm_exec_sessions S ON S.session_id = R.session_id CROSS APPLY sys.dm_exec_sql_text(sql_handle) AS T CROSS APPLY sys.dm_exec_query_plan(plan_handle) As P GO |
If you want to create simple monitoring tool than create the following monitoring table. This is the script for that:
| CREATE TABLE [dbo].[MyMonitorTable]( [text] [nvarchar](max) NULL, [query_plan] [xml] NULL, [host_name] [nvarchar](128) NULL, [program_name] [nvarchar](128) NULL, [client_interface_name] [nvarchar](32) NULL, [login_name] [nvarchar](128) NOT NULL, [session_id] [smallint] NOT NULL, [request_id] [int] NOT NULL, [start_time] [datetime] NOT NULL, [status] [nvarchar](30) NOT NULL, [command] [nvarchar](16) NOT NULL, [sql_handle] [varbinary](64) NULL, [statement_start_offset] [int] NULL, [statement_end_offset] [int] NULL, [plan_handle] [varbinary](64) NULL, [database_id] [smallint] NOT NULL, [user_id] [int] NOT NULL, [connection_id] [uniqueidentifier] NULL, [blocking_session_id] [smallint] NULL, [wait_type] [nvarchar](60) NULL, [wait_time] [int] NOT NULL, [last_wait_type] [nvarchar](60) NOT NULL, [wait_resource] [nvarchar](256) NOT NULL, [open_transaction_count] [int] NOT NULL, [open_resultset_count] [int] NOT NULL, [transaction_id] [bigint] NOT NULL, [context_info] [varbinary](128) NULL, [percent_complete] [real] NOT NULL, [estimated_completion_time] [bigint] NOT NULL, [cpu_time] [int] NOT NULL, [total_elapsed_time] [int] NOT NULL, [scheduler_id] [int] NULL, [task_address] [varbinary](8) NULL, [reads] [bigint] NOT NULL, [writes] [bigint] NOT NULL, [logical_reads] [bigint] NOT NULL, [text_size] [int] NOT NULL, [language] [nvarchar](128) NULL, [date_format] [nvarchar](3) NULL, [date_first] [smallint] NOT NULL, [quoted_identifier] [bit] NOT NULL, [arithabort] [bit] NOT NULL, [ansi_null_dflt_on] [bit] NOT NULL, [ansi_defaults] [bit] NOT NULL, [ansi_warnings] [bit] NOT NULL, [ansi_padding] [bit] NOT NULL, [ansi_nulls] [bit] NOT NULL, [concat_null_yields_null] [bit] NOT NULL, [transaction_isolation_level] [smallint] NOT NULL, [lock_timeout] [int] NOT NULL, [deadlock_priority] [int] NOT NULL, [row_count] [bigint] NOT NULL, [prev_error] [int] NOT NULL, [nest_level] [int] NOT NULL, [granted_query_memory] [int] NOT NULL, [executing_managed_code] [bit]NOT NULL, [group_id] [int] NOT NULL, [query_hash] [binary](8) NULL, [query_plan_hash] [binary](8) NULL ) GO |
For automated SQL Server monitoring, you need to create a SQL Server Agent Job that executes the code below every minute.
| INSERT INTO MyMonitorTable SELECT T.text, P.query_plan, S.host_name, S.program_name, S.client_interface_name, S.login_name, R.* FROM sys.dm_exec_requests R JOIN sys.dm_exec_sessions S on S.session_id=R.session_id CROSS APPLY sys.dm_exec_sql_text(sql_handle) AS T CROSS APPLY sys.dm_exec_query_plan(plan_handle) As P GO |
After running job we can see what SQL Server statements have been captured. For this we have to query the MyMonitorTable table as shown in the image below:
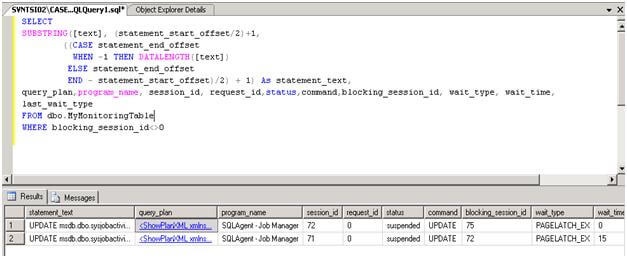
Please note that this simple monitoring script does not show all transactions like SQL Server Profiler. With SQL Server Agent Job this script provides only samples SQL Server transactions by the minute. This script is for capturing long-running, queries, may causing blocking and run frequently.
As you begin to use this script for initial troubleshooting, focus columns like host_name, program_name, database_id, user_id, reads, writes, wait_type, wait_time, last_wait_type and wait_resource.
First, run this in development or QA environments. After that you should run this in the production environment.